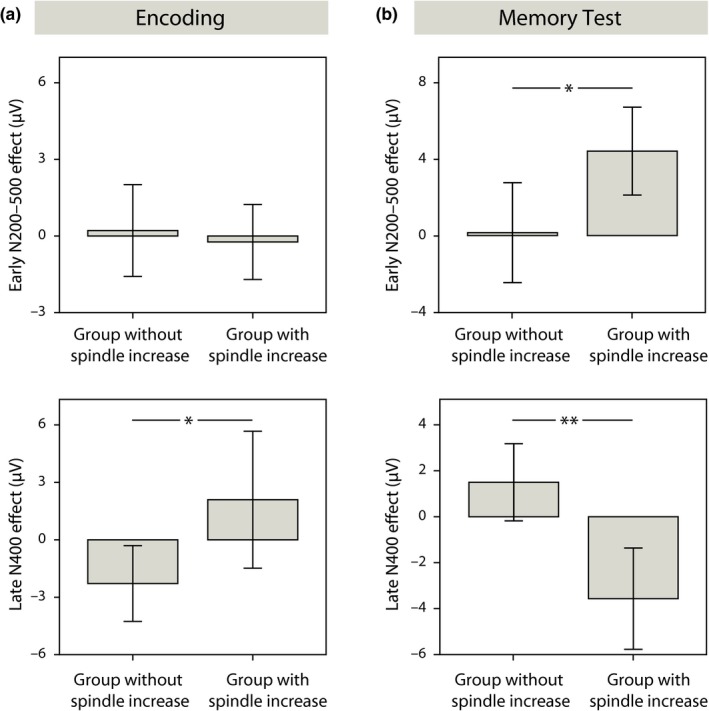
Figure 4.

Comparison between the generalization effects of the spindle subgroups. Mean ERP responses with error bars (±2 SEM) in the subgroup with substantial learning‐related increase in spindle density (above the median of the whole group) and in the subgroup without substantial spindle density increase (below the median), (a) during encoding and (b) during the memory test. Upper panels: early N200–500 effect, lower panels: late N400 effect. *p < 0.05, **p < 0.01
