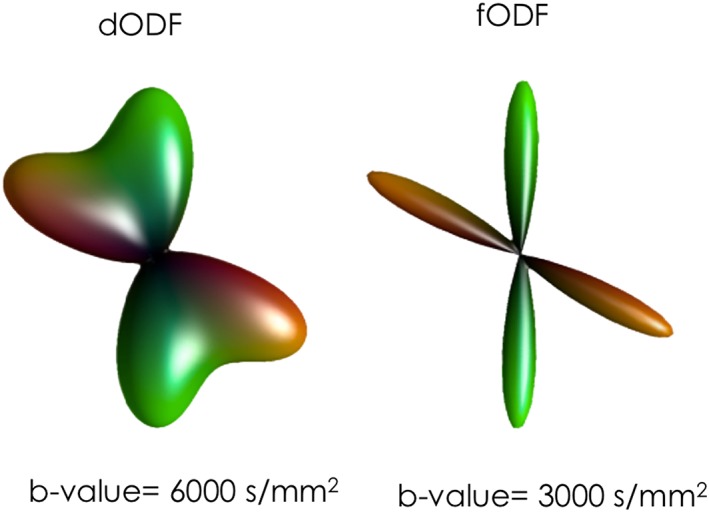
Figure 5.

60° fibre crossing configuration visualized using dODF and fODF profiles. On the left, the dODF is obtained from DSI, with a maximum b‐value of 6000 s/mm2. On the right, the fODF is obtained using spherical deconvolution with b = 3000 s/mm2
