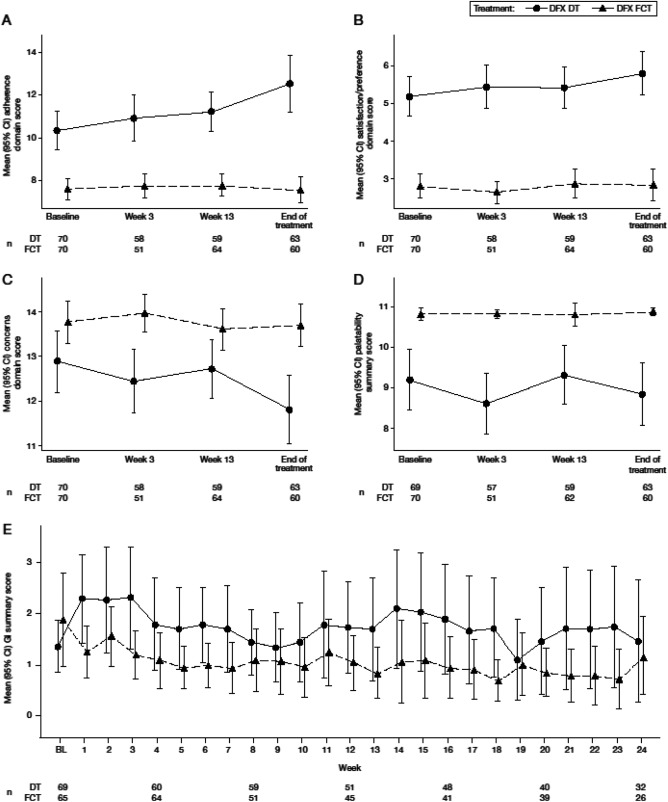
Figure 1.

Mean domain scores for patient‐reported outcomes (adherence, satisfaction/preference, and concern) (A‐C), mean palatability score (D), and mean gastrointestinal symptom scores (E). For adherence (A; scale 6‐30), satisfaction/preference (B; scale 2‐10), and GI symptoms (E; scale 0‐50), higher scores indicate worse outcomes/symptoms. For concern (C; scale 3‐15) and palatability (D; scale 0‐11), higher scores indicate fewer concerns and better palatability. A‐D, baseline was defined as week 2 assessment. If missing, then the week 3 assessment was considered baseline; E, baseline was defined as week 1 score. If missing, then the week 2 score was considered baseline. BL, baseline.
