Figure 4.

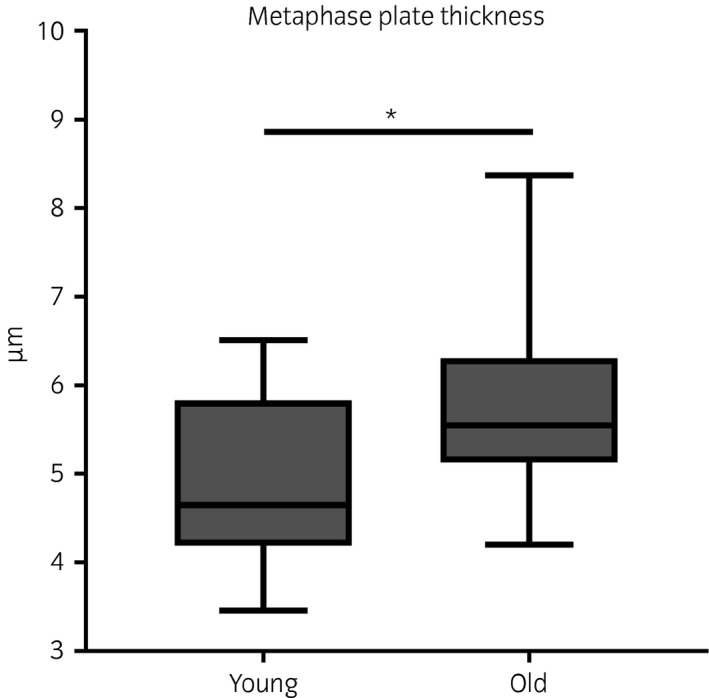
Box plot representation of metaphase plate thickness in the oocytes of mares of different ages (young: ≤14 years and old: ≥16 years). Asterisks indicate significant differences, P<0.05.

Box plot representation of metaphase plate thickness in the oocytes of mares of different ages (young: ≤14 years and old: ≥16 years). Asterisks indicate significant differences, P<0.05.