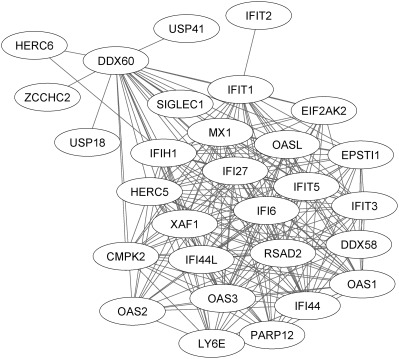
Figure 2.

Characterization of network connectivity between highly expressed interferon (IFN) response genes. As shown by the lines connecting individual genes, a network of highly correlated genes is expressed in the systemic lupus erythematosus (SLE) cohorts, the majority of which have been identified previously as IFN response genes. There is, however, substantially greater complexity of the IFN network than has been previously described (for additional information, see Patients and Methods, and Supplementary Material, available on the Arthritis & Rheumatology web site at http://onlinelibrary.wiley.com/doi/10.1002/art.39950/abstract). Briefly, the Weighted correlation network analysis module (“Yellow module”) containing this network is correlated with all 3 clinical end points: (IFN signature [ρ = 0.90, P < 2 × 10−308], Safety of Estrogens in Lupus Erythematosus National Assessment version of the SLE Disease Activity Index [ρ = 0.22, P = 5 × 10⁻²¹], anti‐DNA activity [ρ = 0.32, P = 4 × 10−43]) (see Supplementary Figure 2 and Supplementary Table 3, available on the Arthritis & Rheumatology web site at http://onlinelibrary.wiley.com/doi/10.1002/art.39950/abstract) and is enriched for the MetaCore‐defined SLE disease pathway (P = 1.14 × 10⁻³² by hypergeometric test) and the gene ontology (GO) “response to type I interferon” gene set (GO:0034340 [P = 6.60 × 10−36]) (see Supplementary Figure 1, available on the Arthritis & Rheumatology web site at http://onlinelibrary.wiley.com/doi/10.1002/art.39950/abstract).
