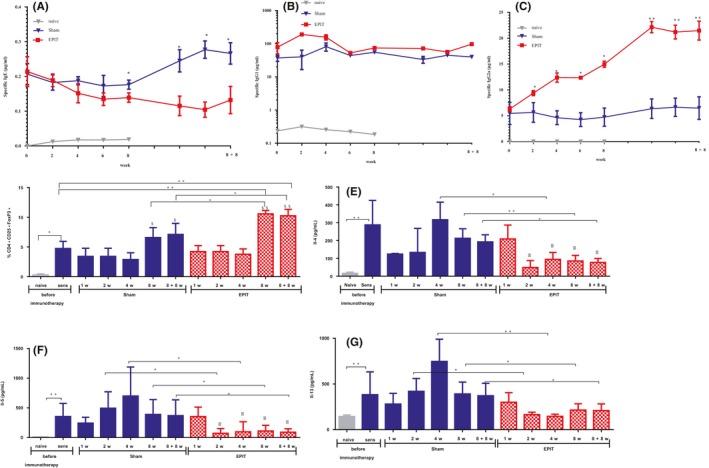
Figure 2.

Epicutaneous immunotherapy (EPIT) decreases the Th2 profile in serological and cellular responses (spleen) to peanut protein extract. (A‐C) Sera were harvested after sensitization to peanut protein (PPE) (W0) and during EPIT (W2, W4, W6, and W8) and after the end of EPIT, in the Sham, EPIT, and naive groups until 8 weeks off treatment (W8 + 8), to measure, respectively IgE, IgG1, and IgG2a reactive to PPE. (D) The percentage of CD4+ CD25+Foxp3+ cells was evaluated after harvesting of splenocytes. (E‐G) Measurement of cytokines secreted by splenocytes after 3 d of reactivation. Results are expressed as mean ± SD in μg/mL or in percentage of total splenocytes for Tregs and in pg/mL for cytokines. Differences between groups were analyzed by a Kruskall‐Wallis test followed by Dunn's multiple comparison test, and differences between time points for the same treatment groups were analyzed by ANOVA followed by Tukey's multiple comparisons test. *P < .05, **P < .01, $ P < .05 Sham 8 wk or Sham 8 + 8 wk vs Sham 1 wk, 2 wk, 4 wk; $$ P < .01 EPIT 8 wk or EPIT 8 + 8 wk vs EPIT 1 wk, 2 wk, 4 wk; Φ P < .05 EPIT 1 wk vs EPIT 2 wk, 4 wk, 8 wk, 8 + 8wk
