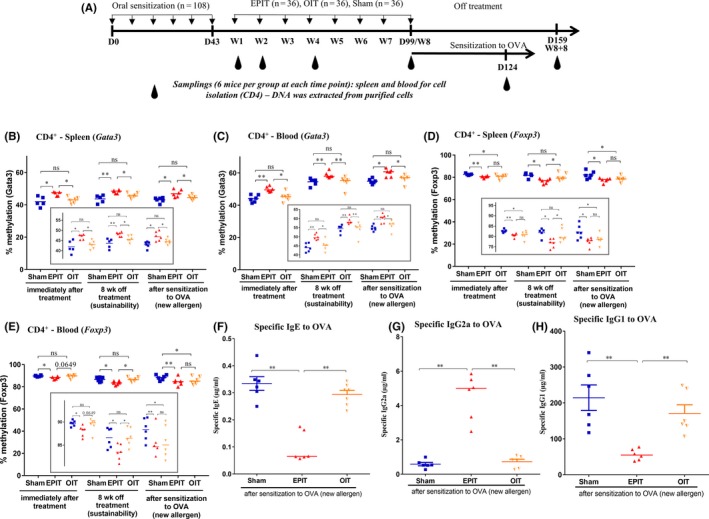
Figure 5.

Epicutaneous immunotherapy (EPIT) leads to a unique DNA methylation profile in CD4+ cells (spleen and blood) compared with oral immunotherapy (OIT) in peanut‐sensitized mice, which is sustained after sensitization to ovalbumin (OVA) (new allergen) and correlates with serological response to OVA. (A) Experimental design. Analysis of the methylation levels of the Gata3 promoter in CD4+ cells isolated from (B) spleen and (C) whole blood at week 8 (8 wk) of EPIT or OIT, 8 weeks after the end of immunotherapies (8 + 8 wk) and after sensitization to OVA. Analysis of the methylation levels of Foxp3 in CD4+ cells isolated from (D) spleen and (E) whole blood at week 8 (8 wk) of EPIT or OIT, 8 weeks after the end of immunotherapies (8 + 8 wk) and after sensitization to OVA. (F‐H) Sera were harvested after EPIT to peanut protein (PPE) and sensitization to OVA for the EPIT, OIT, and Sham groups, to measure, respectively, IgE, IgG1, and IgG2a reactive to OVA. For methylation analyses, differences between groups were analyzed by a Kruskall‐Wallis test followed by Dunn's multiple comparison test. For sera, differences between groups were analyzed by a Mann‐Whitney test. Results are expressed as individual data and median. ns nonsignificant, *P < .05, **P < .01
