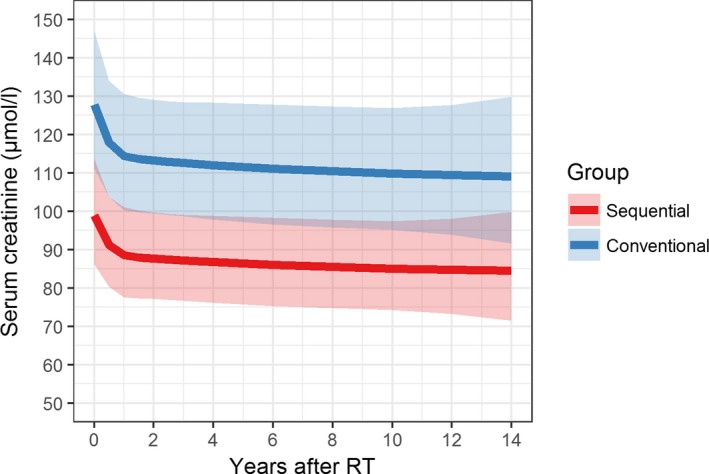
Figure 4.

Mixed model for log2‐transformed serum creatinine levels modeling time using natural splines with 3 knots. Estimates were transformed to original scale. The shaded areas around the model estimates constitute 95% confidence intervals. The overall difference between the 2 groups was significant. No relevant difference in the change of creatinine levels over time between the 2 groups was found. Four patients from the control group had to be excluded due to missing longitudinal serum creatinine measurements. We restricted the analysis to the first 14 years after RT due to lack of serum creatinine measurements for most OEDTR patients thereafter. RT, renal transplantation [Color figure can be viewed at wileyonlinelibrary.com]
