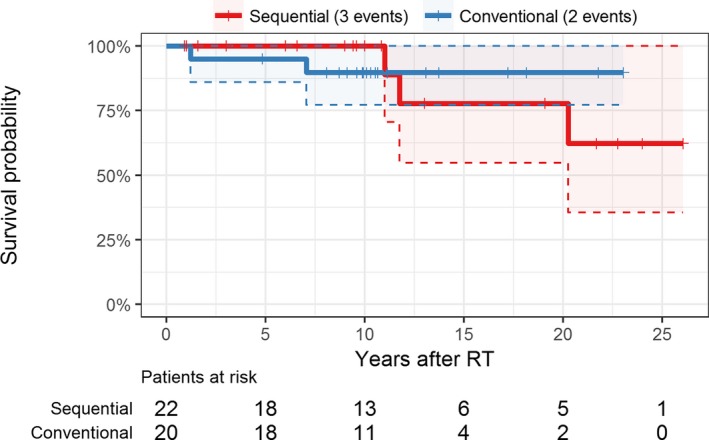
Figure 6.

Kaplan‐Meier plot of overall patient survival; shaded areas and dashed lines represent 95% confidence intervals. Overall there were 4 deaths in the sequential group but one was treated as censored at the last follow‐up visit as the exact time of death is unknown. RT, renal transplantation [Color figure can be viewed at wileyonlinelibrary.com]
