
Figure 2.
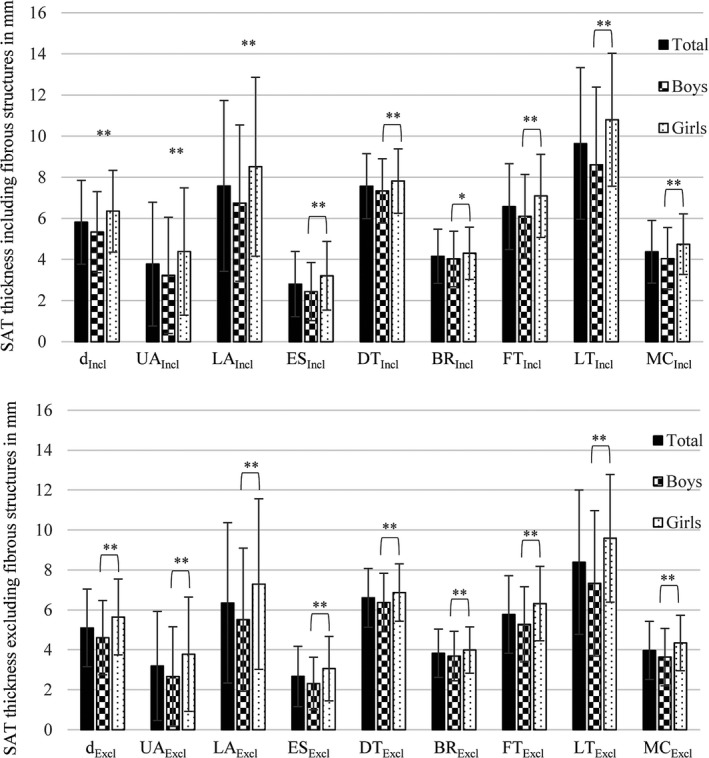
Mean subcutaneous adipose tissue thickness (d) and mean thicknesses at the eight individual sites: upper abdomen (UA), lower abdomen (LA), erector spinae (ES), distal triceps (DT), brachioradialis (BR), front thigh (FT), lateral thigh (LT) and medial calf (MC). Upper image: subcutaneous adipose tissue (SAT) values including (Incl) embedded structures. Lower image: SAT values excluding (Excl) embedded structures. Significant differences between boys and girls indicated as *p < 0.05 and **p < 0.01.