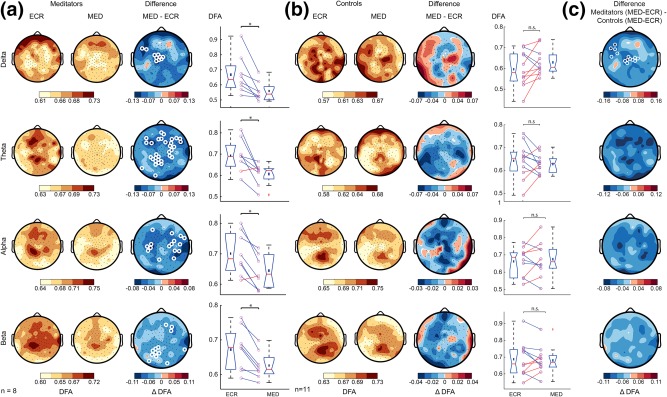
Figure 4.

Study 1: Only meditation practitioners exhibit weaker LRTC during meditation compared to rest. (a) Grand‐average topographies of DFA are shown for ECR (first column) and MED (second column), and the difference of MED minus ECR (third column). Fourth column shows the average DFA exponent across significant electrodes for each subject. The delta‐band did not pass the multiple‐comparison criterion, but the topography speaks for the same trend as theta, alpha, and beta. (b) The same plots as in (a) are shown for the control group. (c) Grand‐average topographies comparing the effect of condition in the meditator and control groups. The difference was calculated as meditators (MED‐ECR) minus controls (MED‐ECR). The rows display the DFA for the delta (1–4 Hz), theta (4–8 Hz), alpha (8–13 Hz), and beta band (13–30 Hz), respectively. White circles denote channels with p < .05 (t‐test, binomial multiple comparison corrected). Meditation reduces the complex dynamics of neuronal oscillations in experienced practitioners, but not in controls [Color figure can be viewed at http://wileyonlinelibrary.com]
