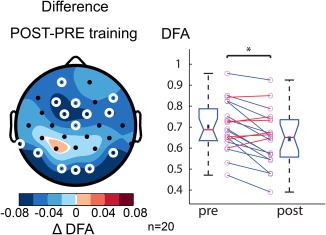
Figure 8.

One year of meditation training is associated lower LRTC during meditation. The topography shows the difference in DFA exponents during meditation before and after one year of meditation training in the alpha band (8–13 Hz). White circles denote channels with p < .05 (t test, binomial multiple comparisons corrected). Right, the average DFA exponent across significant electrodes for each subject at the intake (pre) and after one year of training (post). After the training, the LRTC of alpha oscillations during MED is reduced. The Greek delta symbol is used to denote a “difference.” [Color figure can be viewed at http://wileyonlinelibrary.com]
