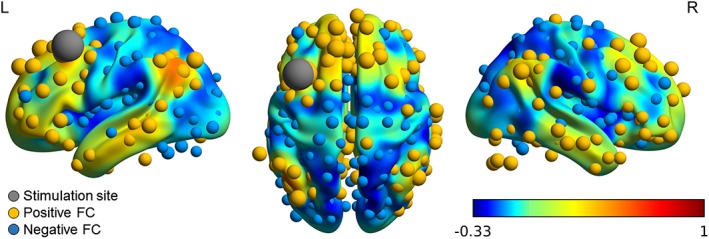
Figure 4.

Functional connectivity (FC) with the stimulation area in the left DLPFC (MNI [−38, 20, 54]) as seed region. The volume shows the overall connectivity map obtained from http://www.neurosynth.org. Functional correlations with the nodes are shown in yellow and blue for positive and negative connections, respectively. The size of the nodes represents the strength of the connectivity [Color figure can be viewed at http://wileyonlinelibrary.com]
