Figure 7.

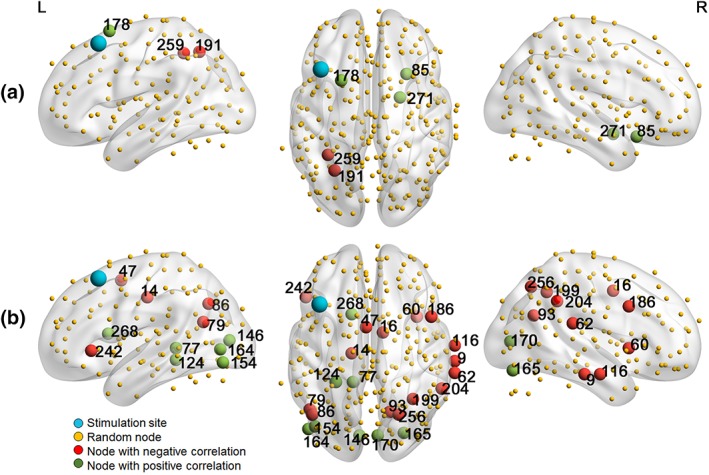
Nodes showing a significant (p < .05) potential of degree (a) or betweenness centrality (b) to predict the effect of verum aiTBS [Color figure can be viewed at http://wileyonlinelibrary.com]

Nodes showing a significant (p < .05) potential of degree (a) or betweenness centrality (b) to predict the effect of verum aiTBS [Color figure can be viewed at http://wileyonlinelibrary.com]