
Figure 7.
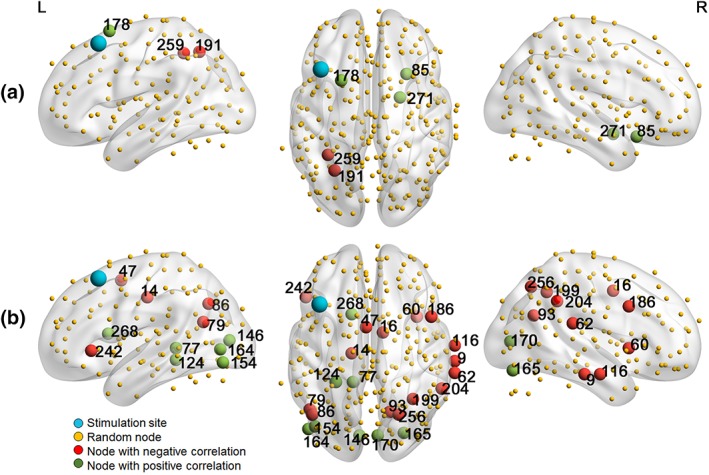
Nodes showing a significant (p < .05) potential of degree (a) or betweenness centrality (b) to predict the effect of verum aiTBS [Color figure can be viewed at http://wileyonlinelibrary.com]
Official websites use .gov
A
.gov website belongs to an official
government organization in the United States.
Secure .gov websites use HTTPS
A lock (
) or https:// means you've safely
connected to the .gov website. Share sensitive
information only on official, secure websites.
Nodes showing a significant (p < .05) potential of degree (a) or betweenness centrality (b) to predict the effect of verum aiTBS [Color figure can be viewed at http://wileyonlinelibrary.com]