Figure B1.

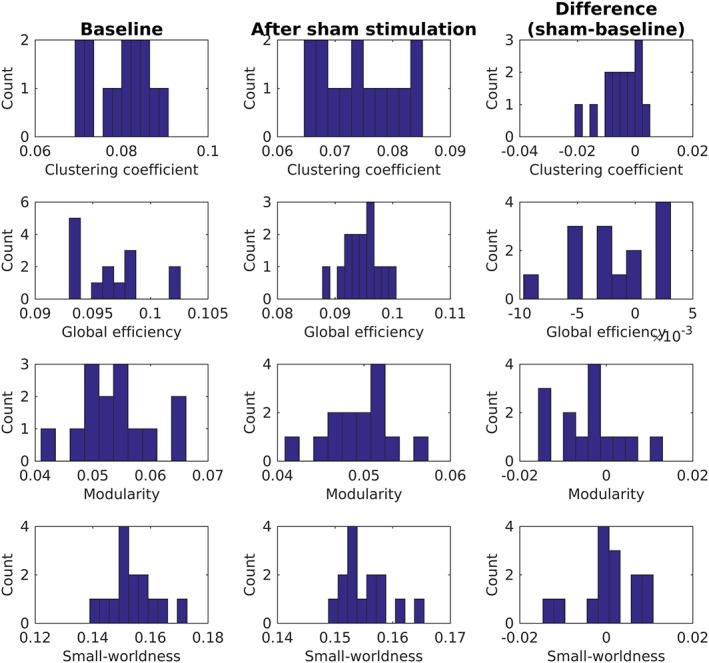
Overview of whole‐brain graph measures for subgroup of patients (n = 14) who received sham aiTBS during the first week of the stimulation protocol [Color figure can be viewed at http://wileyonlinelibrary.com]

Overview of whole‐brain graph measures for subgroup of patients (n = 14) who received sham aiTBS during the first week of the stimulation protocol [Color figure can be viewed at http://wileyonlinelibrary.com]