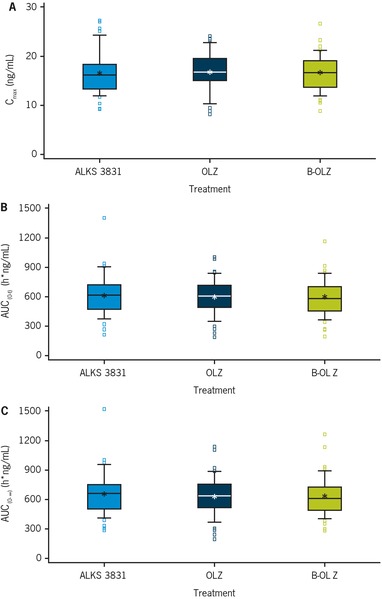
Figure 3.

Comparison of OLZ (A) Cmax, (B) AUC0‐t, and (C) AUC0‐∞ after a single dose of ALKS 3831, OLZ, or B‐OLZ. The bottoms and tops of the boxes represent the 25th and 75th percentiles, respectively; the whiskers represent the 10th and 90th percentiles; the lines within the boxes represent the medians; the stars represent the means. The squares represent the values smaller than the 10th percentile or values greater than the 90th percentile. AUC0‐∞, area under the plasma concentration‐time curve from zero to infinity; AUC0‐t, area under the plasma concentration‐time curve from zero to the time of the last quantifiable concentration; B‐OLZ, brand olanzapine; Cmax, maximal plasma concentration; OLZ, olanzapine.
