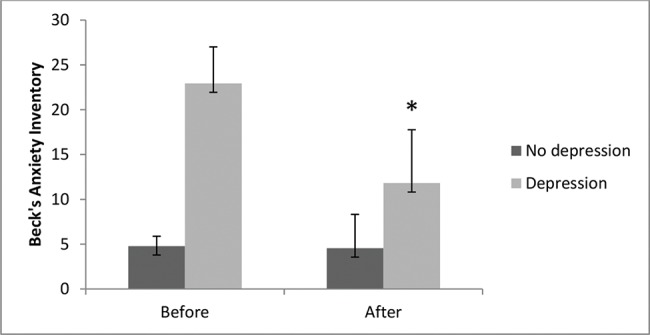
Figure 3.

Comparison between anxiety levels before and after the aquatic exercise program. Data are expressed as the means ± standard errors of the mean. The χ2 test for nonparametric analyses was also used, followed by the Bonferroni post hoc test. The symbol (*) indicates intragroup significant differences (p <0.05).
