. 2019 May 24;10(24):6035–6071. doi: 10.1039/c9sc01652j

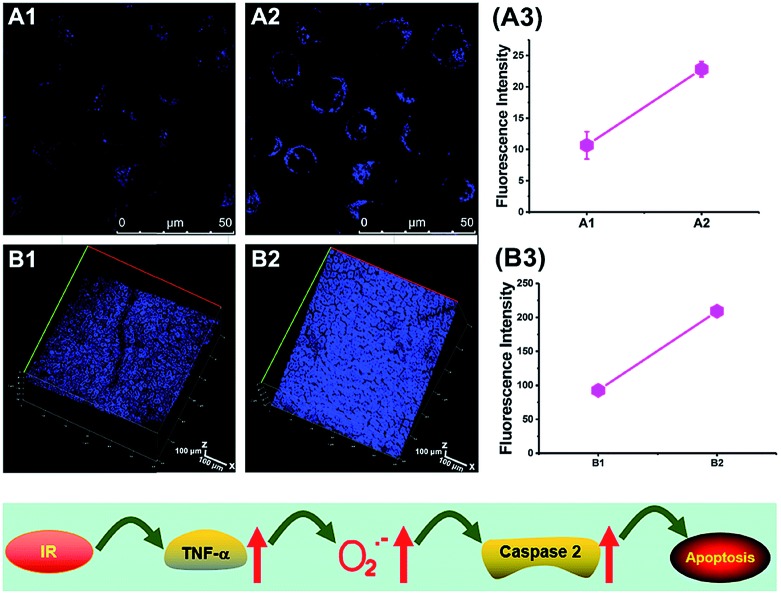
Fig. 31. Top: Increased O2˙ levels in IR cells and mice. (A) The normal (A1) and IR hepatic (A2) cells loaded with 10 μM 64 for TP fluorescence imaging, and (A3) the average fluorescence intensity output of (A). (B) The in vivo 3D images of normal (B1) and IR mice (B2) injected with 10 μM 64 for TP fluorescence imaging, and (B3) the average fluorescence intensity output of (B). Images were acquired at an excitation wavelength of 800 nm and emission wavelengths corresponding to the blue channel of 430–530 nm. Bottom: Model for the signalling role of O2˙ in IR cells and mice. Adapted with permission from ref. 31a. Copyright 2019 Royal Society of Chemistry.

Fig. 31