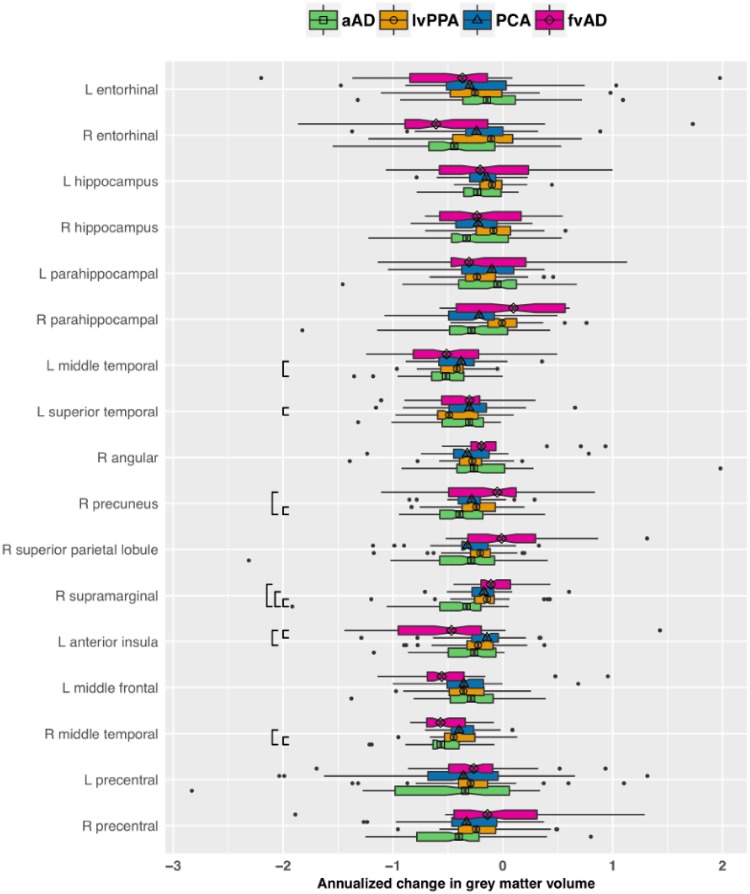
Figure 2.
Patient group differences in the effect of time for a priori regions of interest. The plot displays annualized change in regional grey matter volume in each group, expressed in z-score units relative to the healthy control reference group and adjusted for sex as well as age and global cognition at initial MRI. More negative values on the x-axis indicate more rapid atrophy over time. The vertical bar in each box indicates the median change in regional volume; the edges of the box represent the IQR, i.e. the difference between the first and third quartiles. The whiskers extend to the most extreme point within 1.5 × IQR from the left or right edge of the box; observations falling outside this range are plotted individually. The notches in each box extend 1.58 × IQR / √n, displaying an ∼95% confidence interval for the median. Black brackets indicate significant pairwise group differences (P < 0.05 after FDR correction). Group is indicated by colour as well as by the shape centred over the median line in each box. aAD = amnestic Alzheimer’s disease; fvAD = frontal variant Alzheimer’s disease.

