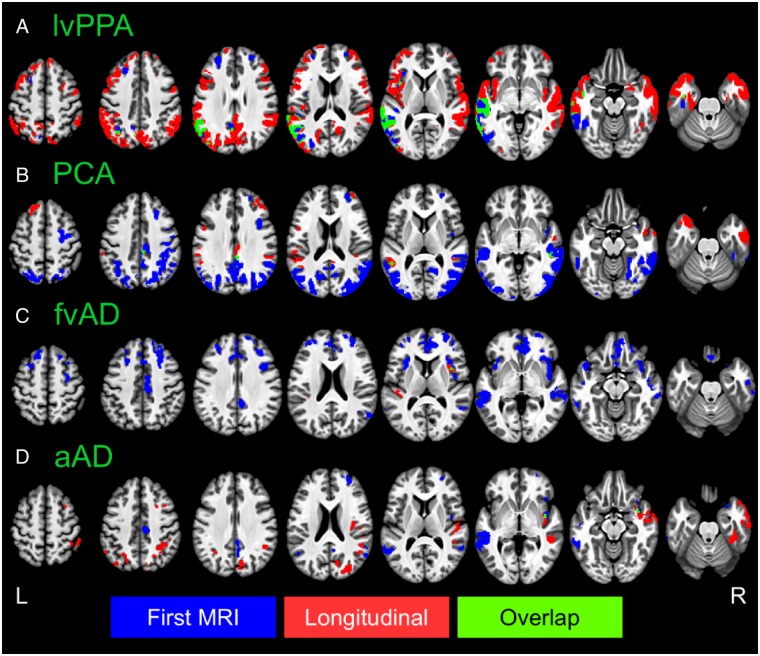
Figure 3.
Voxelwise differences in cortical thickness relative to matched controls. Image overlays are binarized t-statistic maps for simple contrasts of controls minus each patient group. Blue: simple effect of group (patients < controls) from cross-sectional analysis of participants’ initial MRI scans; red: group × time interaction from longitudinal mixed effects models, indicating where patients have more rapid cortical thinning than controls; green: overlap between group and group × time effects. All results were thresholded at voxelwise P < 0.001 with a minimum cluster volume of 584 µl for results at initial MRI and 600 µl for longitudinal results, corresponding to a corrected cluster-wise threshold of P < 0.05. aAD = amnestic Alzheimer’s disease; fvAD = frontal variant Alzheimer’s disease.

