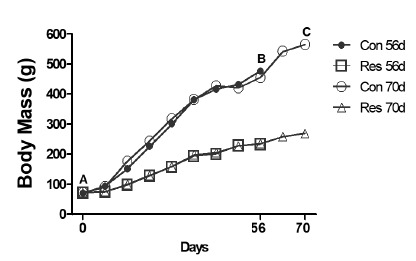
Figure 2. Comparison of body mass (g) among subgroups. (A) On day 0 there was no significant difference among the four subgroups (p>0.05). Over time, the diet-restricted animals showed a lower mass acquisition (p<0.05). The 56 (B) and 70 days (C) represent the days of euthanasia. Con 56: Control group, followed by 56 days; Res 56: Dietary restriction group, followed by 56 days; Con 70: Control group, followed by 70 days; Res 70: Dietary restriction group, followed by 70 days. (Data from the Laboratory of Bioengineering, School of Medicine of Ribeirao Preto, with permission).

