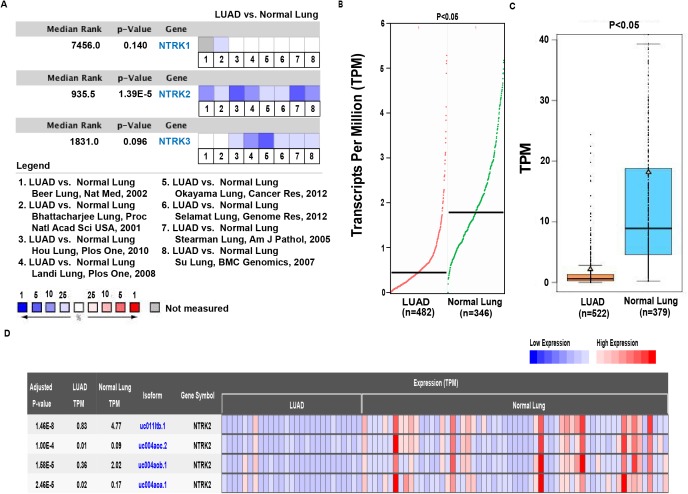
Figure 1. Analysis of NTRK2 expression levels in LUAD tissues.
(A) The comparison of the messenger RNA (mRNA) expression of NTRK (NTRK1, NTRK2 and NTRK3) among eight datasets by comparing the surrounding normal lung tissues and LUAD. (B–D) The mRNA expression of NTRK2 was evaluated from the database GEPIA, GE-mini and CRN, respectively.

