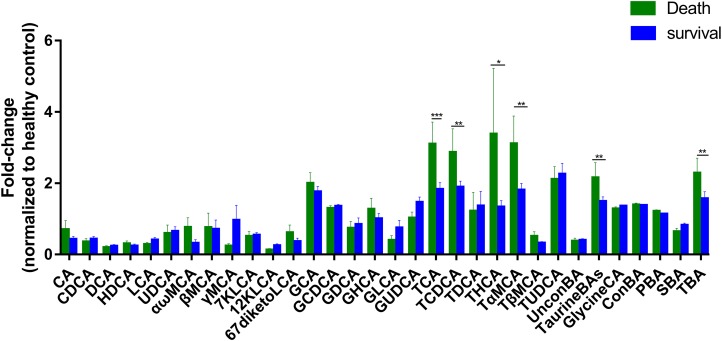
Figure 3. Differential serum bile acid profiling among the two cohorts.
The fold-changes in bile acid levels between ESRD death and survival groups (relative to the control cohort) are graphically displayed. Normally-distributed data are depicted in a bar graph with means and standard errors of the mean (SEMs). *P < 0.1; **P < 0.05; ***P < 0.01.

