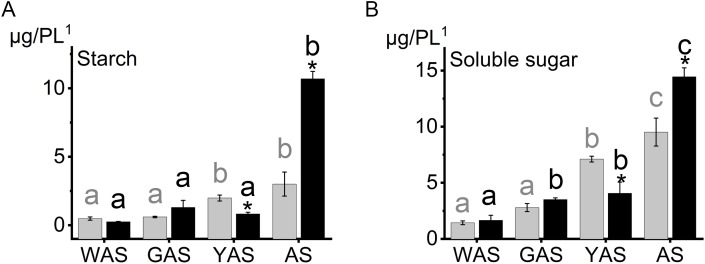
Figure 2. Starch, soluble sugar content in lodicules of YM18 (gray column) and ZK001 (black column).
(A) Comparison of starch content change tendency in lodicules between YM18 and ZK001. (B) Comparison of soluble sugar content change tendency in lodicules between YM18 and ZK001. PL1: pair of lodicules (PL). The results presented are the means of three independent experiments. Error bars, s.d. Columns marked with different lowercase letter indicate difference in means using the one-way ANOVA LSD analysis of PASW Statistics software among four flower development stage of YM18 (gray lowercase) and ZK001 (black lowercase). The asterisk indicates the difference between YM18 and ZK001 at WAS, GAS, YAS, and AS, respectively. The data were further analyzed using an ANOVA at a 95% confidence level following Duncan’s test (SPSS 18.0; IBM, Somers, NY, USA). The level of significance was set at P ≤ 0.05 or P ≤ 0.001.

