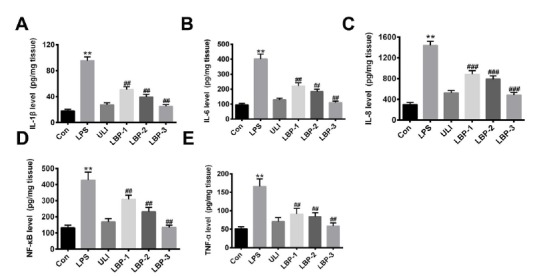
Figure 1. Influence of LBP on the expressions of immune factors in sepsis induced rat kidney. (A) IL-1β; (B) IL-6; (C) IL-8; (D) NF-κB; (E) TNF-α. **, P<0.01, versus the control group; ##, P<0.01, versus the LPS group. Normal control group (Con): normal feeding; LPS model group (LPS): intraperitoneal injection with LPS (5 mg/kg); Ulinastatin group (ULI): intravenous injection with Ulinastatin (10000 U/kg); LBP-1 group: giving intragastric administration with 200 mg/kg LBP 1h after LPS injection; LBP-2 group: giving intragastric administration with 400 mg/kg LBP 1h after LPS injection; LBP-3 group: giving intragastric administration with 800 mg/kg LBP 1h after LPS injection.

