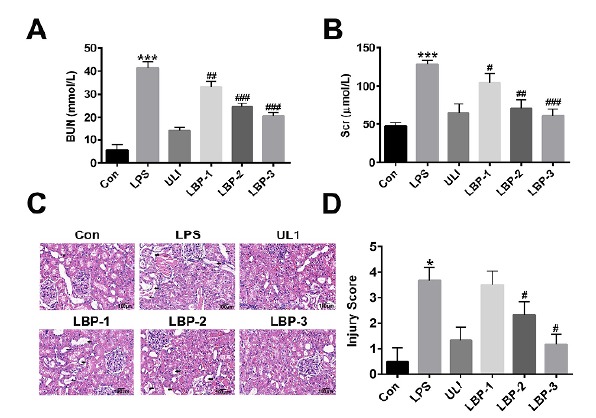
Figure 2. Function and Pathological morphology observation of kidney tissue among groups. (A) Blood urea nitrogen (BUN) and (B) creatinine levels in heparinized rat blood samples. (C) Pathological morphology observation of kidney tissue. (D) The kidney injury scores determined by light microscopy on a scale of 0-5. **, P<0.01, versus the control group; ##, P<0.01, versus the LPS group. Normal control group (Con): normal feeding; LPS model group (LPS): intraperitoneal injection with LPS (5 mg/kg); Ulinastatin group (ULI): intravenous injection with Ulinastatin (10000 U/kg); LBP-1 group: giving intragastric administration with 200 mg/kg LBP 1h after LPS injection; LBP-2 group: giving intragastric administration with 400 mg/kg LBP 1h after LPS injection; LBP-3 group: giving intragastric administration with 800 mg/kg LBP 1h after LPS injection.

