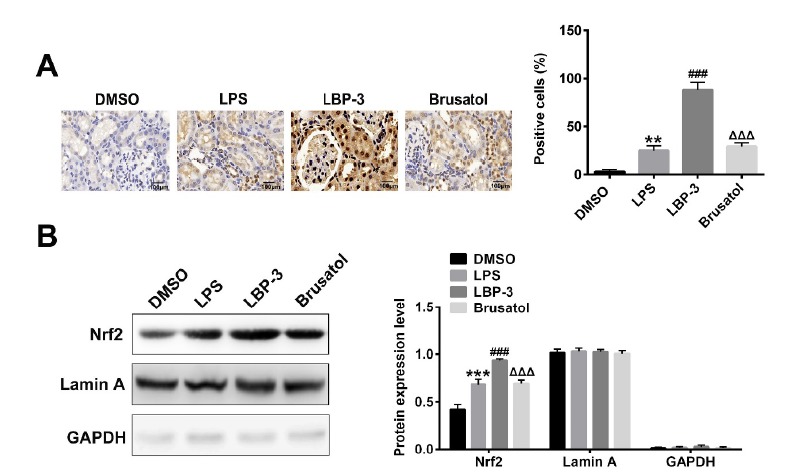
Figure 4. LBP treatment increases the Nrf2 accumulation in nucleus by activating Keap1- Nrf2∕ARE signaling pathway. (A) Immunohistochemical study of Nrf2 positive cells in kidney tissue after different treatments. (B) Nuclear accumulation of Nrf2 among different groups determined by Western blot. ***, P<0.001, versus the DMSO group; ###, P<0.001, versus the LPS group; ΔΔΔ, P<0.001, versus the LBP group. DMSO control group (DMSO): intraperitoneal injection with DMSO. LPS model group (LPS): intraperitoneal injection with LPS (5 mg/kg); LBP-3 group: giving intragastric administration with 800 mg/kg LBP 1h after LPS injection; Brusatol group: intraperitoneal injection with LPS together with 2 mg/kg of brusatol, then LBP was administrated 1h after.

