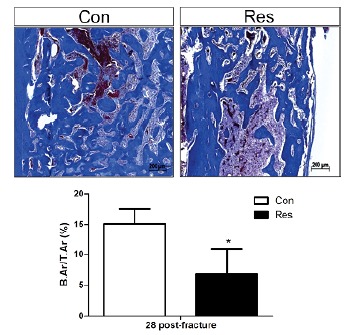
Figure 7. Bone callus 28 days post-fracture. The newly formed bone was significantly reduced in the dietary restricted rats and the degree of reduction is expressed quantitatively in the graph below (B.Ar/T.Ar, %). Asterisk indicates significant difference (p<0.05) (Masson’s trichrome, x100).

