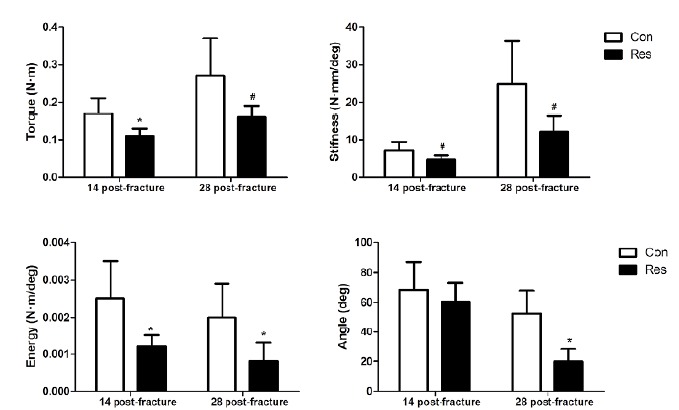
Figure 8. Parameters of the torsion test. The diet restricted animals showed smaller figures, which indicates a weakening of the bone (except for angle displacement at failure). Asterisks indicate significant differences (p<0.05) and hashtags indicate p=0.06.

