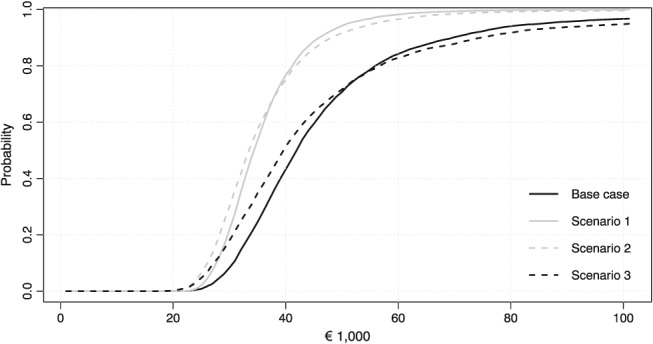
Figure 4.

Curves indicating the probability that the k‐threshold is below a certain monetary value for the base case scenario and Scenarios 1, 2, and 3 (NB: Scenario 4 is not displayed because it almost overlaps with the base case scenario. Scenario 5 is not displayed because the probability that the k‐threshold is below a certain monetary value remains low for all monetary values)
