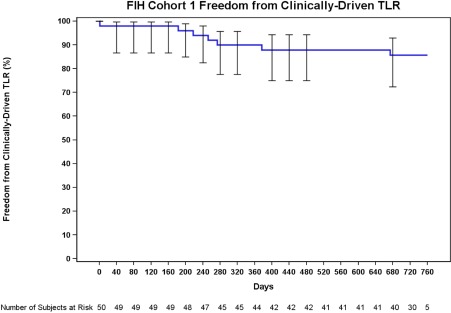
Figure 2.

The freedom from clinically‐driven TLR was 90.0% at 12 months (day 365) and 87.9% at day 395, the upper end of the follow‐up window. The rate was 85.8% throughout the 24‐month follow‐up window (at day 730 and day 760). [Color figure can be viewed in the online issue, which is available at wileyonlinelibrary.com.]
