Fig. 4.
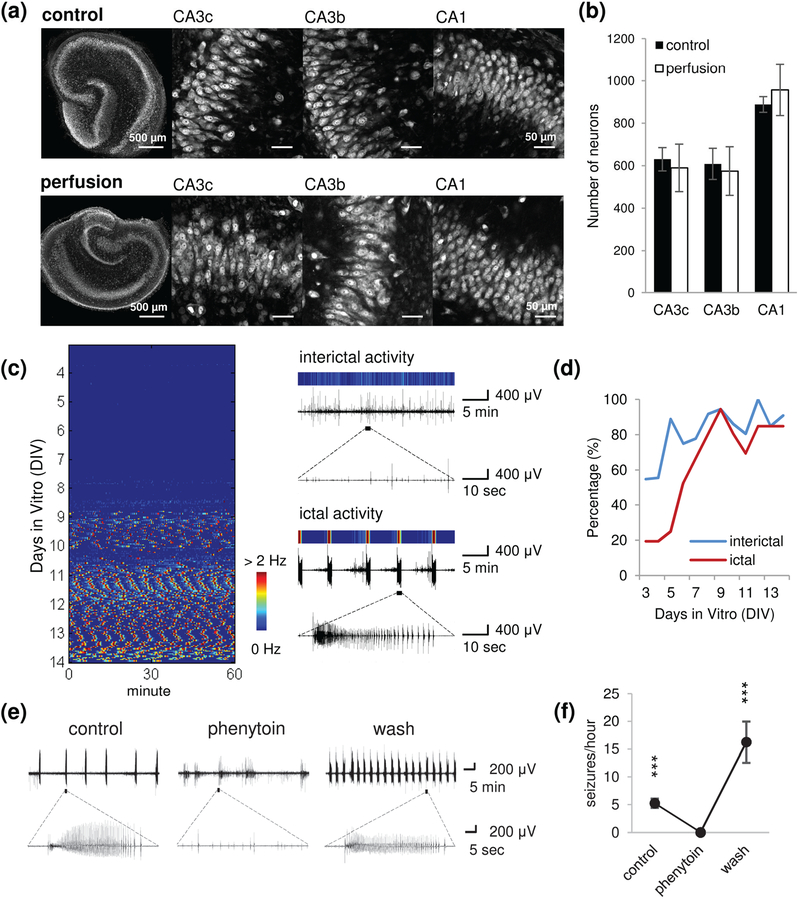
Epilepsy-on-a-chip model validation. (a) Representative confocal imaging of NeuN staining in control cultures (interface method) and perfused cultures (μflow-MEA) on 14 day in vitro (DIV), and high magnification images of CA3c, CA3b and CA1 regions. Scale bars as indicated in figure. (b) Neuron counts in CA3c, CA3b, and CA1. n = 9 each condition. (c) Left: representative raster plot of chronic recording from 4 to 14 DIV. Color corresponds to the frequency of paroxysmal events, with low frequency indicated by blue, and high frequency (seizures) indicated by red. Each horizontal line of the raster plot represents one hour of recording, with 24 lines per DIV. Right: the color map of interictal activity (top trace) and ictal activity (seizure, bottom trace). (d) Incidence of ictal and interictal activity as a percentage of cultures recorded on μflow-MEA, with age of culture. n = 36 cultures, from 10 animals. (e) Representative recordings for each time period (control, phenytoin treatment, wash). (f) Seizure frequency during each period. n = 3. Error bars indicate SD. Statistical significance is indicated as ***, representing p < 0.001.

