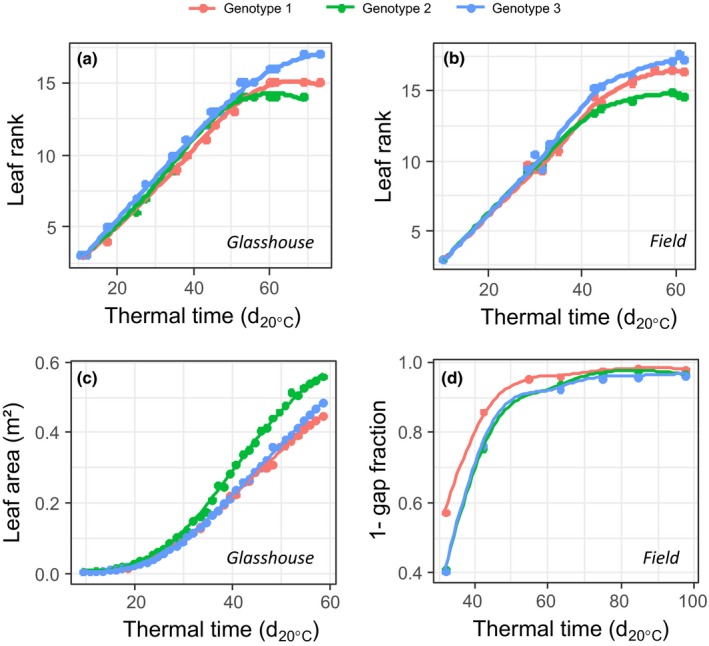
Figure 2.

Example of trait variables that either (a, b) easily map between experiments in glasshouse and field or (c, d) do not map because of methodological difficulties. (a, b) Leaf appearance rate as function of thermal time for three genotypes in (a) glasshouse and (b) field experiments. (c, d) The progression of leaf area, either measured directly in the glasshouse (c) or via gap fraction (see Fig. 3b) in the field for the same three genotypes. For each genotype, points are the mean of nine and three replicates for the glasshouse and field experiments respectively.
