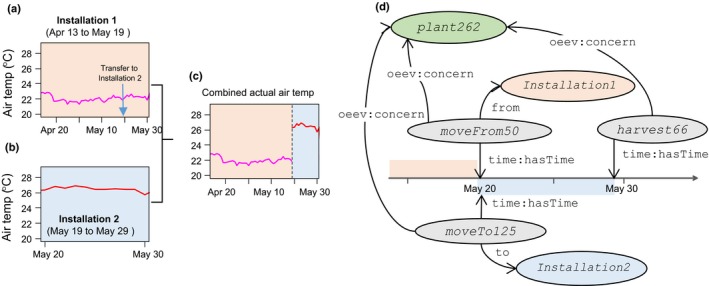
Figure 5.

Example of object tracking using the Ontology for Experimental Phenotypic Objects (OEPO) and Ontology of Experimental Events (OEEv) ontologies for following plant 262 over time in two installations. (a) Air temperature conditions in Installation 1 where biovolume is measured from 13 April to 19 May. (b) Air temperature conditions in Installation 2. (c) Air temperature sensed by plant 262 resulting from combining air temperatures of Installations 1 and 2. (d) Associated informal semantic graph representing such event. Boxes with different colours represent different object types (green for plant material, orange and blue for installations and grey for events). Names in this figure are neutral for better legibility. Corresponding names for consulting the online information system are ‘phenoarch’ for ‘installation1’ and ‘phenodyn’ for ‘installation2’.
