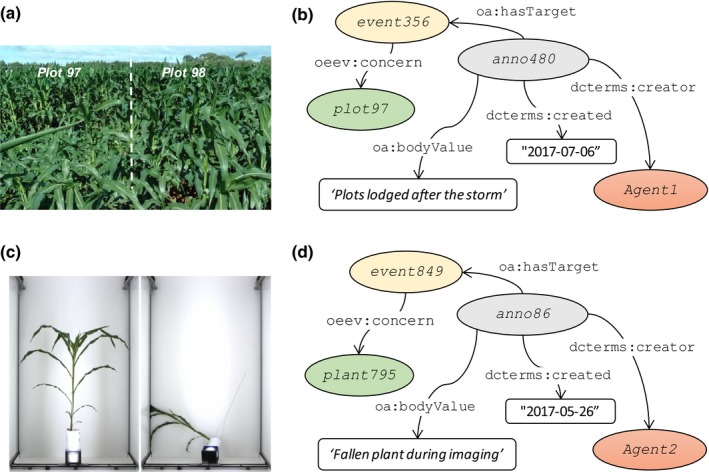
Figure 7.

Examples of data annotation in the Phenotyping Hybrid Information System for describing (a) a lodging event occurring in the field (installation1) and (c) an accident during image acquisition in the glasshouse (installation2). (b, d) Informal semantic graphs representing the information associated with each event (users, installations, plots, plants, description) using the Ontology of Experimental Events ontology and the web annotation data model. Names in this figure are neutral for better legibility. Instances, classes and literals are depicted as coloured ellipses, white rectangles and white lozenges respectively. Relationships and properties are depicted as black lines. Note that this is a simplified representation. Corresponding names for consulting the online information system are rchapuis for ‘Agent1’ and ‘lcabrera’ for ‘Agent2’, ‘diaphen’ for ‘installation1’ and ‘phenoarch’ for ‘installation2’.
