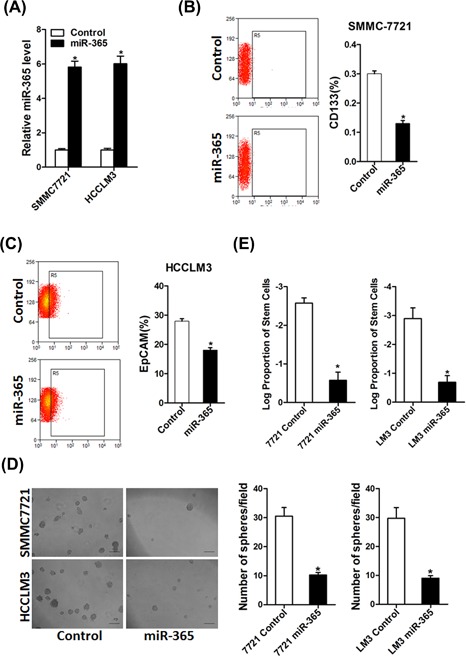
Figure 2.

miR‐365 repressed the expansion of liver CSCs. (A) HCCLM3 and SMMC7721 cells were infected with miR‐365 overexpression virus and the sable infectants were checked by real‐time PCR. (B) Flow cytometric analysis of the proportion of CD133+ cells in miR‐365 overexpression and control 7721 cells. (C) Flow cytometric analysis of the proportion of EpCAM+ cells in miR‐365 overexpression and control LM3 cells. (D) Spheres formation assay of miR‐365 overexpression and control hepatoma cells. (E) The frequency of liver CSCs in 7721 miR‐365 or LM3 miR‐365 and their control cells was compared by in vitro limiting dilution assay
