
Figure 4.
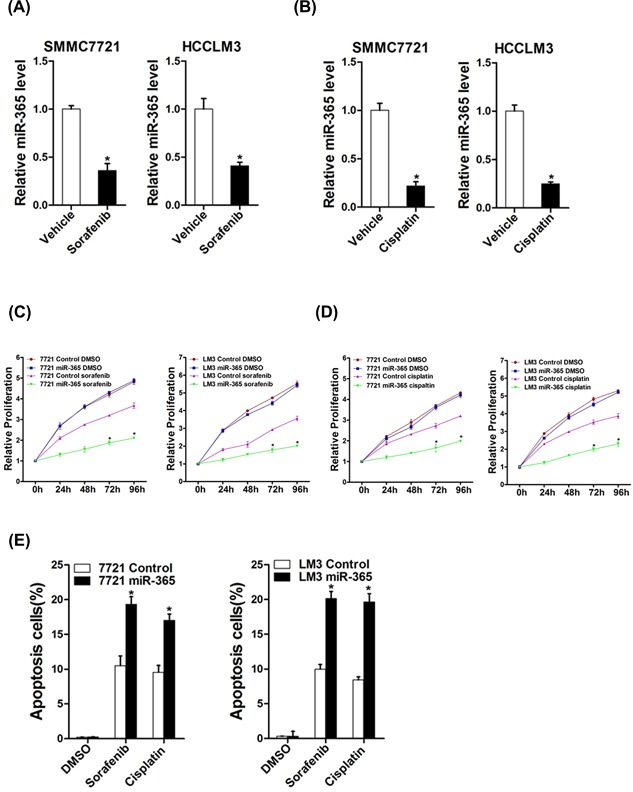
The effect of miR‐365 on drug resistance of HCC to sorafenib and cisplatin. (A) The expression of miR‐365 in sorafenib‐resistant was downregulated. (B) The expression of miR‐365 in cisplatin‐resistant was downregulated. (C) 7721 miR‐365 or LM3 miR‐365 and their control cells cultured in 96‐well plates were treated with 10 µM sorafenib, and cell viability was measured at the indicated time points using Cell Counting Kit‐8. (D) Cell proliferation of HCC cell lines with overexpressing miR‐365 compared with control cells when exposed to the same dosages of cisplatin (1 µg/mL). (E) 7721 miR‐365 or LM3 miR‐365 and their control cells were treated with different doses cisplatin or sorafenib for 24 h. Percentage of apoptotic cells was determined by fluorescence‐activated cell sorting