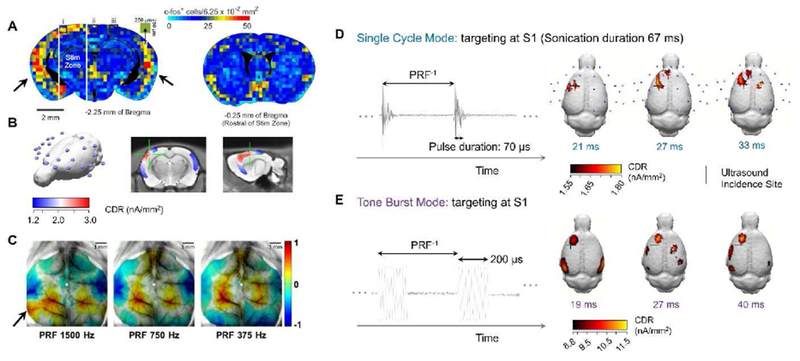
Figure 2.

A. Psuedo-colored maps c-fos+ cell densities at three coronal brain sections. The brain areas between the two white lines were targeted with tFUS. The black arrows indicate the ancillary activations. (adapted from [15]) B. 24-channel rat EEG electrodes covering a 3-D reconstructed rat brain. The current source density reconstructed in electrophysiological source imaging (ESI) is displayed in a coronal section. The green cross indicates the stimulation target of the tone-burst tFUS shown in E. C. Shown as a principal component, local hemodynamic changes detected by optical imaging on awake mice suggested a dependence of brain activations on ultrasound PRF (adapted from [48]. D. The illustrated single cycle mode employs short pulse duration (fundamental frequency FF: 500 kHz). ESI-based global images localize the brain activation due to tFUS aiming at primary somatosensory cortex (S1) in this single-cycle mode. Measured ultrasound peak-to-peak pressure is 88.7 kPa, and the pulse duration is 70 μs. Maximal current density is shown at the local area targeted by tFUS in all ESI frames, while no significant auditory response can be seen among these images. E. The tone burst mode integrates multiple sinusoidal cycles for each pulse. Directing the tone burst mode tFUS onto S1 triggers brain responses at S1 and bilateral auditory cortices. In this mode, the pulse duration is elongated to 200 μs for 100 cycles per pulse.
