
Figure 3.
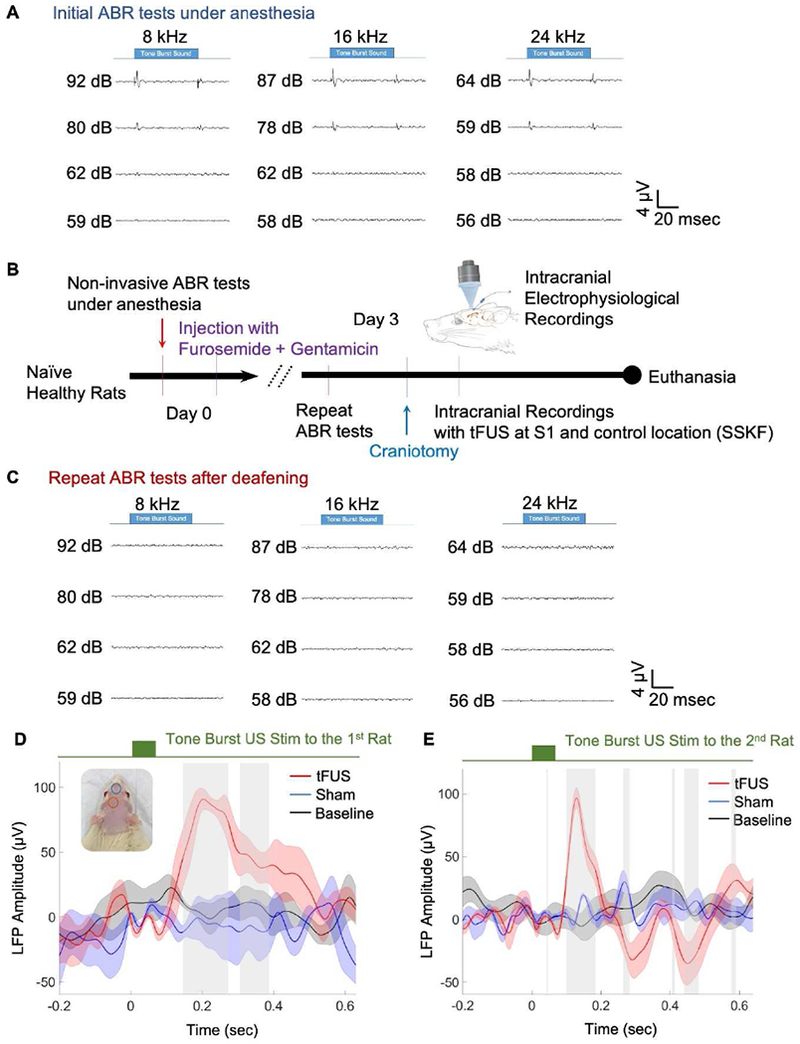
A. ABR tests in anesthetized rats before chemical deafening. B. The experimental protocol to induce deafening, conduct ABR tests, and subsequently the intracranial recording. C. ABR tests in anesthetized rats after chemical deafening. D and E. In two chemically-deafened rats, temporal waveforms of local field potentials (LFPs) recorded at S1 from baseline (averaged across 288 trials), tFUS at S1 and anterior control location (sham, both averaged across 318 trials). The ultrasound conditions are illustrated in the inset with corresponding colors for tFUS (orange circle) and sham (green circle). The LFPs are presented with the mean value (solid line) and standard error of the mean (shaded areas). The gray bars indicate significant differences between tFUS and sham conditions (p < 0.05).