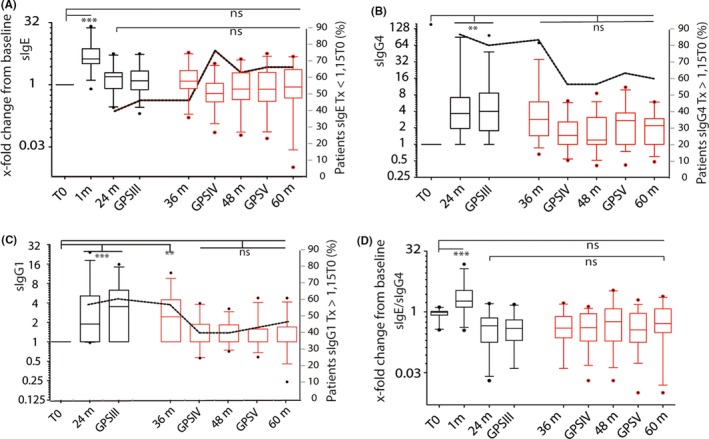
Figure 1.

Modulation of allergen‐specific Ig by grass tablet SLIT. sIgE (A), sIgG 4 (B), sIgG 1 (C), and sIgE/sIgG 4 (D) levels are shown as the x‐fold change from baseline for the two main Phleum allergens, Phl p 1+p 5. ***P ≤ 0.001, **P ≤ 0.01, ns: not significant. Dotted line indicates the percentage of the population (n = 30) showing lower sIgE levels (A) and higher sIgG 4 (B) or sIgG 1 (C) levels than preimmunotherapy
