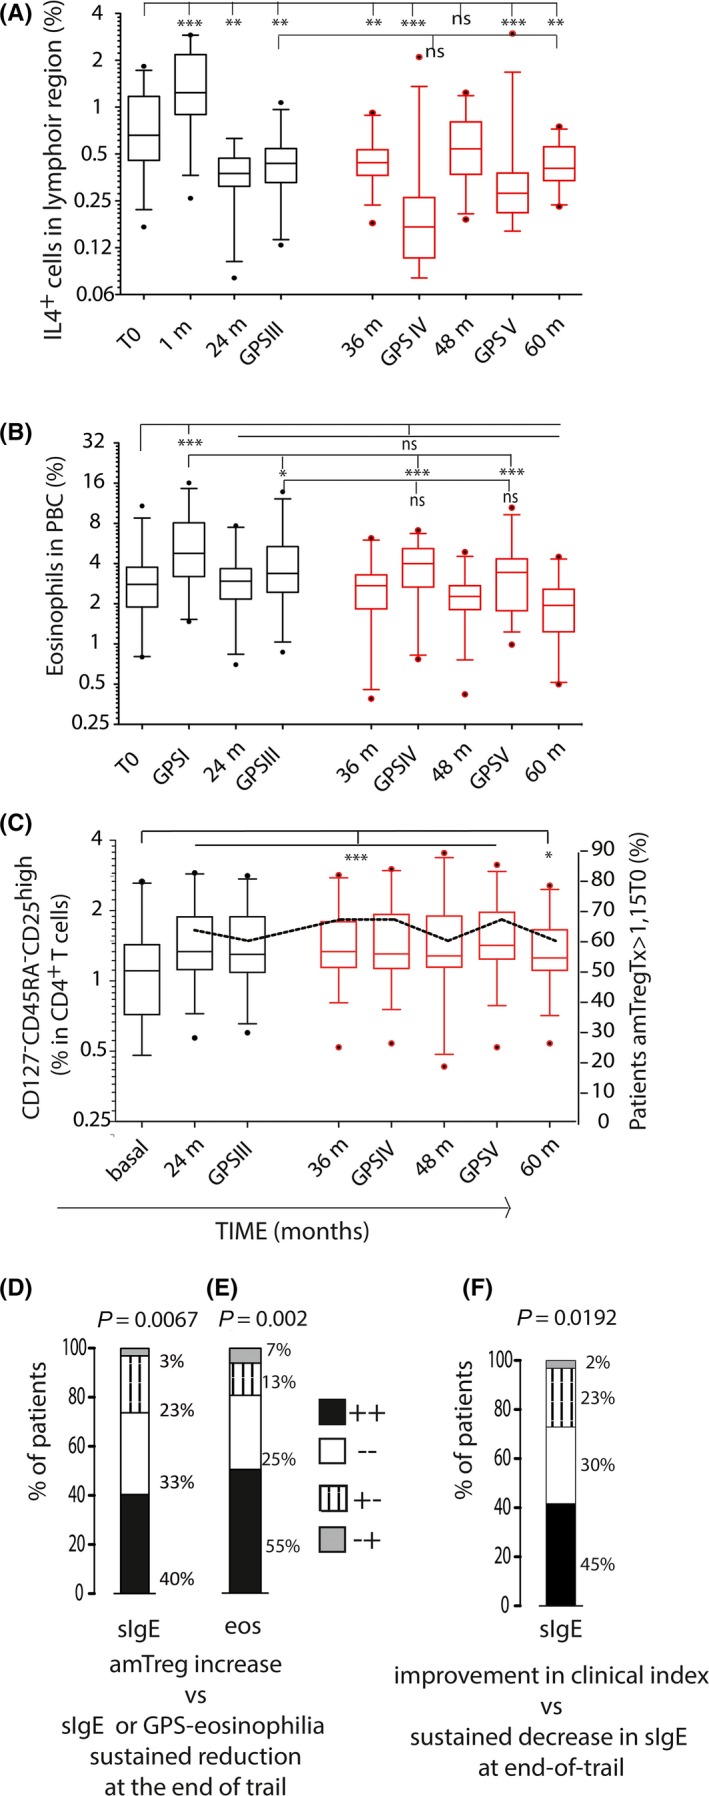
Figure 3.

Modulation of cellular and cytokine profiles by grass tablet SLIT. A‐B, Percentages of circulating IL4+ (A) cells and eosinophils (B) throughout the trial (n = 30). C, Sustained generation of a amTreg‐like cell‐mediated response over time. ***P ≤ 0.001, **P ≤ 0.01, *P < 0.05, ns: not significant. D‐F, Contingency tables of variables distribution in the population; Fisher's test was applied. Percentage of patients showing at the end of trial both increase in amTreg‐like cell and low sIgE levels compared to baseline (black bars), neither (white bars), or only one condition (amTreg cell generation, dashed bars; sIgE values lower than T0, gray bars) (D); and data as above, comparing amTreg cell generation and sustained reduction in GPS‐associated eosinophil counts (E). Percentage of patients showing both end‐of‐trial sustained reduction in sIgE and improvement in clinical index (black bars), neither (white bars), or only one condition (sustained improvement in clinical index, dashed bars; end‐of‐trial sustained reduction in sIgE levels, gray bars) (F)
