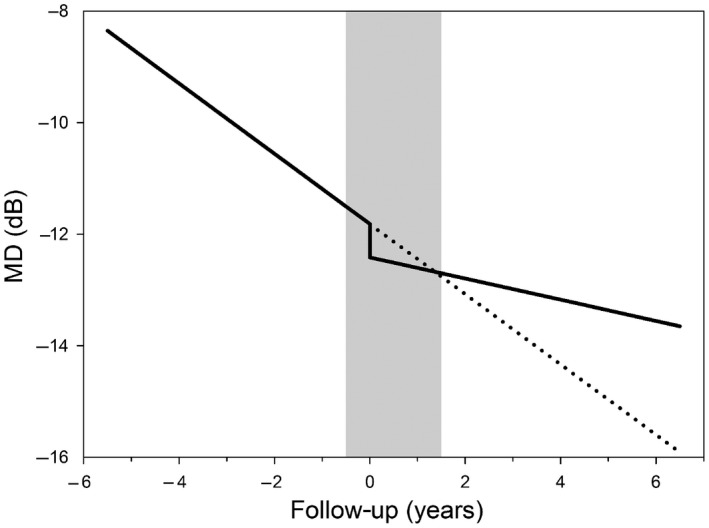
Figure 4.

Schematic time–course of the visual field mean deviation (MD) with (continuous line) and without (dashed line) surgery. The surgery itself is performed at time‐point 0 years. The surgery‐induced drop in MD is counterbalanced by the slower rate of progression, on average 1.5 years after surgery (crossing of continuous and dashed line). The grey bar depicts the period in which no perimetry is performed (from 6 months before to 1.5 years after surgery; see Results section). The observed drop in MD, that is the difference in MD between the beginning and the end of the grey bar, is about twice as large as the actual drop in MD, because of autonomous disease progression in the period without perimetry.
