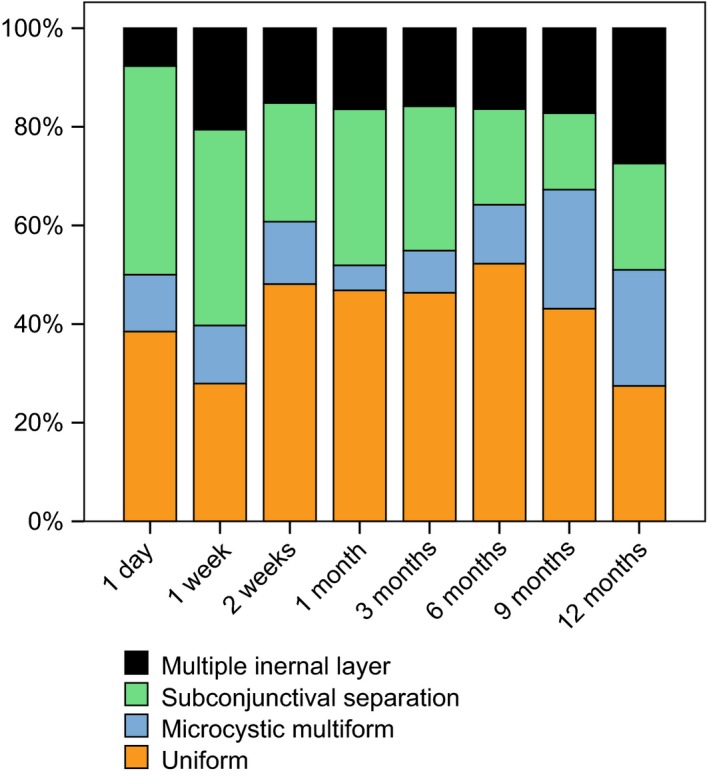
Figure 4.

Stacked histograms of bleb morphology in anterior segment optical coherence tomography (AS‐OCT) after XEN Glaucoma Gel Microstent implantation over time. Uniform bleb morphology showed at week 1 (p < 0.004) higher mean intraocular pressure (IOP) compared to the other three morphologies in AS‐OCT separately. Comparing uniform bleb morphology against all other morphologies combined, a statistically significant higher mean intraocular pressure (IOP) was detected in uniform blebs at week 1 (p < 0.001), week 2 (p < 0.001), month 1 (p = 0.005) and month 3 (p = 0.04). A strong negative correlation between the timelines of subconjunctival separation morphology prevalence at all visits in the AS‐OCT and the mean IOP could be shown (r = −0.75, p = 0.031). Significant changes of bleb morphology in AS‐OCT between visits are shown in Table 2.
