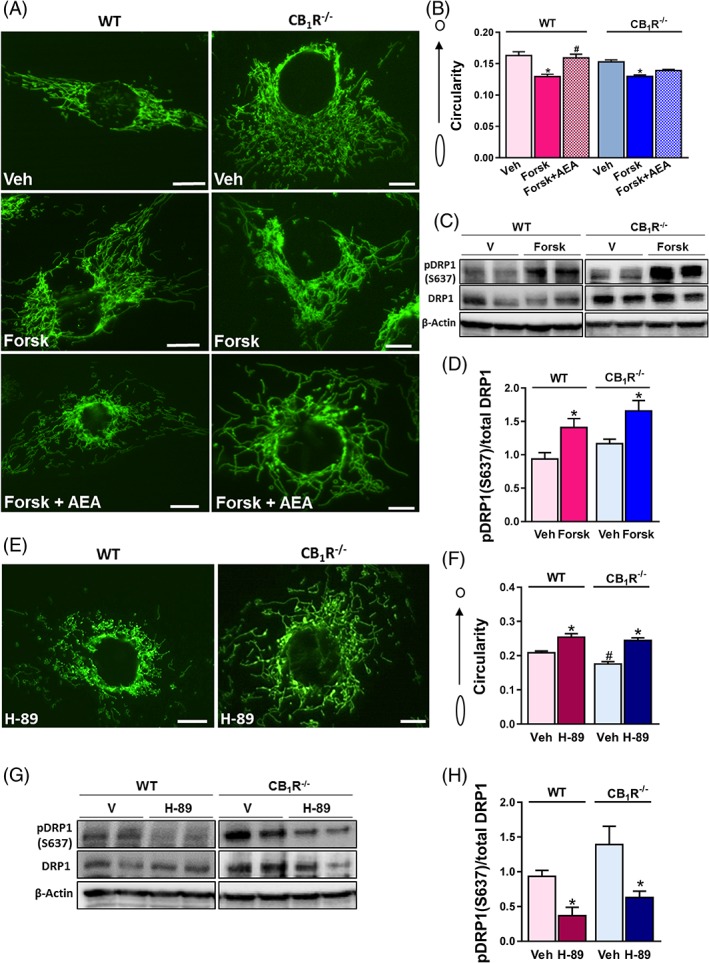
Figure 4.

CB1R‐mediated mitochondrial fragmentation is cAMP‐dependent. A, WT‐HK‐2 or CB1R‐/‐‐HK‐2 cells, stably transfected with MitoGFP, were treated with vehicle (Veh) or 25 μM Forskolin for 1 hour to induce cAMP generation. AEA was then added to selected wells and live cells were examined under a fluorescent microscope to visualize mitochondrial morphology. B, Circularity was quantified using ImageJ macro.23 Data represent the mean ± SEM from >30 cells in each group. C, D, Western blot analysis and quantification of pDRP1 (s637). E, 10 μM of H‐89 were added to both cell lines for 3 hours, and F, circularity was quantified using ImageJ macro.23 Data represent the mean ± SEM from 30–120 cells in each group. G, H, Western blot analysis and quantification of pDRP1 (s637). Western blot data represent the mean ± SEM of four–five replicates from two independent experiments. *P < 0.05 relative to Veh‐treated animals or HK‐2 of the same cell line. # P < 0.05 relative to the same treated group in WT mice or HK‐2 cells
