Figure 1.

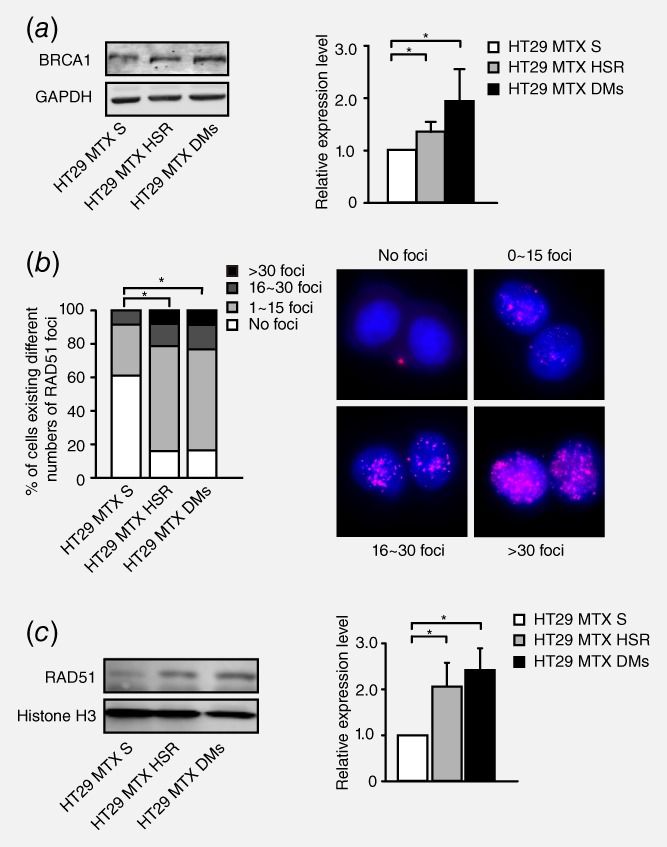
Correlation between the level of HR and gene amplification in HT29 MTX‐sensitive and MTX‐resistant cells. a. Western blot analysis of the BRCA1 protein level in HT29 MTX‐sensitive cells and HSR‐ and DM‐containing MTX‐resistant cells. The right panel shows densitometry values. Protein densities are normalized to the GAPDH expression level, and the BRCA1 expression levels of HSR‐ or DM‐containing cells are compared with that of MTX‐sensitive cells. Values are mean ±SD (n = 3, *p<0.025). b. Immunofluorescence assay for RAD51 foci in HT29 MTX‐sensitive, HSR‐ and DM‐containing cells. Cells are grouped into four categories according to the number of RAD51 foci: no foci, 1–15 foci, 16–30 foci and >30 foci. Group standards are shown in the right panel. The left panel shows the proportion of these cells in each category (n>75, *p<0.025). c. Western blot analysis of RAD51 nuclear protein levels in HT29 MTX‐sensitive, HSR‐containing and DM‐containing MTX‐resistant cells. The right panel shows densitometry values (n = 3, *p<0.025).
