
Figure 2.
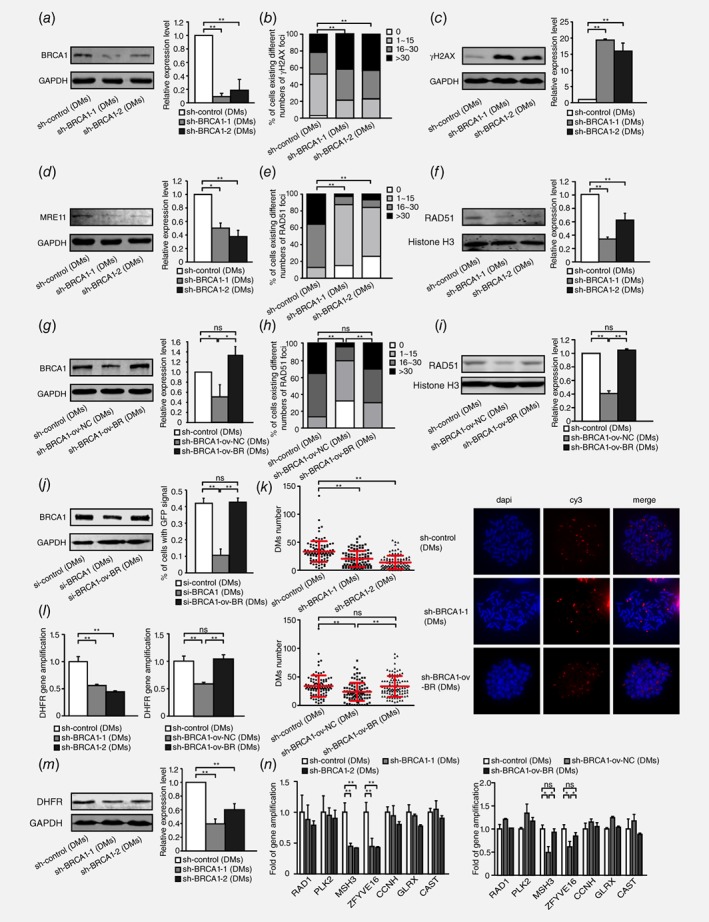
Inhibition of BRCA1 exacerbates double‐strand DNA breaks, suppresses HR and decreases DM‐form amplification in DM‐containing MTX‐resistant cells. a. Western blot analysis of BRCA1 protein levels and densitometry values in DM‐containing cells: control and two BRCA1‐depleted clones (n = 3, **p<0.005). b. IF assay for γH2AX protein in DM‐containing control and two BRCA1‐depleted clones (n ≥ 100, **p<0.005). c. Western blot bands for the γH2AX protein level, densitometry values in DM‐containing control and two BRCA1‐depleted clones (n = 3, **p<0.005). d. Western blot analysis of MRE11 protein level and densitometry values in DM‐containing control and two BRCA1‐depleted clones (n = 3, *p<0.025, **p<0.005). e. IF assay for RAD51 foci in DM‐containing control and two BRCA1‐depleted clones (n ≥ 100, **p<0.005). f. Western blot analysis of RAD51 nuclear protein levels and densitometry values in DM‐containing control and two BRCA1‐depleted clones (n = 3, **p<0.005). g. Western blot analysis of BRCA1 protein level and densitometry values in DM‐containing control, BRCA1‐depleted control and BRCA1‐depleted rescued cells (n = 3, *p<0.025). h. IF assay for RAD51 foci in DM‐containing control, BRCA1‐depleted control and BRCA1‐depleted rescued cells (n ≥ 100, **p<0.005). i. Western blot analysis of RAD51 nuclear protein levels and densitometry values in DM‐containing control, BRCA1‐depleted control and BRCA1‐depleted rescued cells (n = 3, **p<0.005). j. Western blot analysis of BRCA1 protein level (left panel) and HR‐GFP repair assay of the percentage of GFP+ cells (right panel) in DM‐containing si‐control, si‐BRCA1 and si‐BRCA1 rescued cells (n = 3, **p<0.005). k. Quantification of DMs with DHFR signal in DM‐containing control and two BRCA1‐depleted clones(left upper panel), and control, BRCA1‐depleted control and BRCA1‐depleted rescued clones (left lower panel), on the basis of FISH analysis of metaphase spreads. Values are mean ±SD. BAC‐containing DHFR was used as a probe and is marked in red; nuclei were stained with DAPI and are marked in blue (right panel) (n ≥ 100, **p<0.005). l. Real‐time PCR analysis of DHFR amplification in DM‐containing control and two BRCA1‐depleted clones (left panel), and control, BRCA1‐depleted control and BRCA1‐depleted rescued clones (right panel) (n = 3, **p<0.005). m. Western blot analysis of DHFR protein level and densitometry values in DM‐containing control and two BRCA1‐depleted clones (n = 3, **p<0.005). n. Real‐time PCR analysis of other genes that co‐localized with DHFR in chromosome 5, including RAD1, PLK2, MSH3, ZFYVE16, CCNH, GLRX and CAST, in DM‐containing control and two BRCA1‐depleted clones (left panel), and control, BRCA1‐depleted control and BRCA1‐depleted rescued clones (right panel) (n = 3, *p<0.025, **p<0.005).