Figure 3.

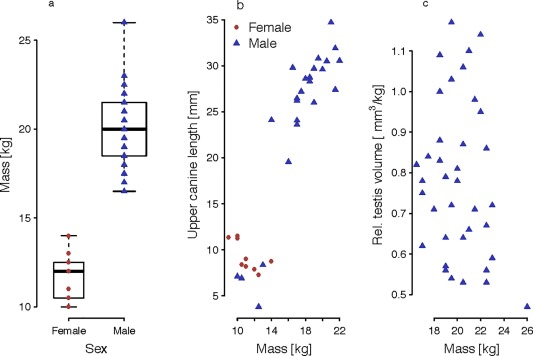
Boxplot with median, IQR, and minimum and maximum values (a). Adult female and adult male body mass. (b) Correlation between maxillary canine height and body mass. (c) Correlation between testicular volume and adult male body mass

Boxplot with median, IQR, and minimum and maximum values (a). Adult female and adult male body mass. (b) Correlation between maxillary canine height and body mass. (c) Correlation between testicular volume and adult male body mass