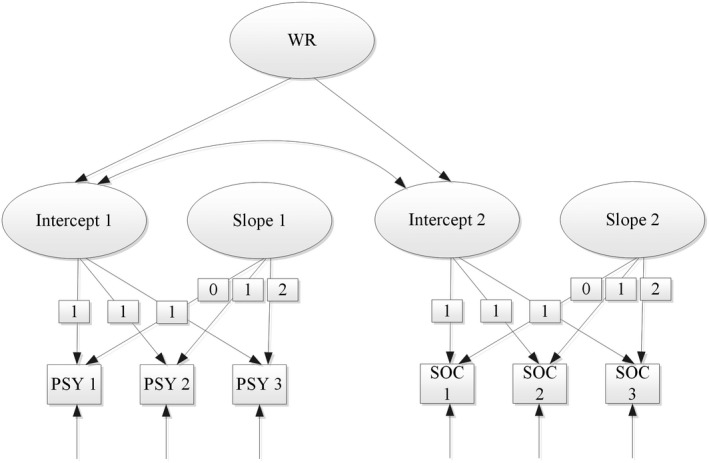
Figure 5.

Multivariate latent growth curve model depicting the influence of the induction arrangement elements on stress causes. Fit statistics: CFI = 0.944, TLI = 0.927, RMSEA = 0.077, SRMR = 0.048.

Multivariate latent growth curve model depicting the influence of the induction arrangement elements on stress causes. Fit statistics: CFI = 0.944, TLI = 0.927, RMSEA = 0.077, SRMR = 0.048.