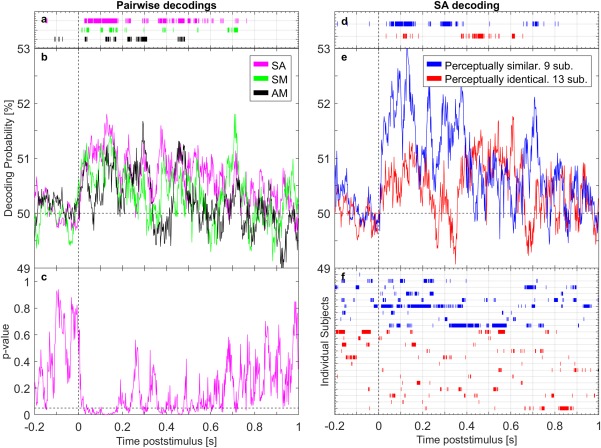
Figure 3.

Two‐class decoding based on evoked potentials to sucrose (Suc), aspartame (Asp), and a mix of aspartame and acesulfame K (Mix) using within‐participant quantitative EEG analysis (qEEG). A classifier was trained to discriminate taste pairs: Suc and Asp (SA), Suc and Mix (SM), and Asp and Mix (AM). The left side of the figure shows qEEG decoding results from all three taste pairs. (a) Periods where the taste pairs were decoded significantly above chance are indicated by bars, and (b) decoding probability for each taste pair averaged across participants. (c) Statistical significance of the SA taste pair detailed at every time point (right tailed t test, α = 5%). The right side of the figure shows qEEG decoding results of the SA taste pair according to the participants’ ability to perceptually discriminate SA. qEEG was performed on perceptually similar taste responses (significant discrimination at 10% significance level, 9 participants) and on perceptually identical taste responses (13 participants). (e) Average decoding probability across participants for the perceptually similar and perceptually identical taste responses, with periods of significant decoding illustrated by bars on (f) an individual level (d) and subgroup level (right tailed t test, α = 5%). Horizontal lines at 50% illustrate chance level [Color figure can be viewed at wileyonlinelibrary.com]
